WiFi coverage testing that talks installer.
SignalMetrics turns your Android phone into a proper site-survey instrument. Walk the property, tap TEST at each spot, and you get a hard number — not a "bars" cartoon — for every corner of the house. When you leave, the customer gets a branded PDF report they can hand to their ISP.
No accounts. No cloud. Free to use — on your own jobs, personal or professional. Everything stays on the device.
 Free to useNow available on Google Play · Android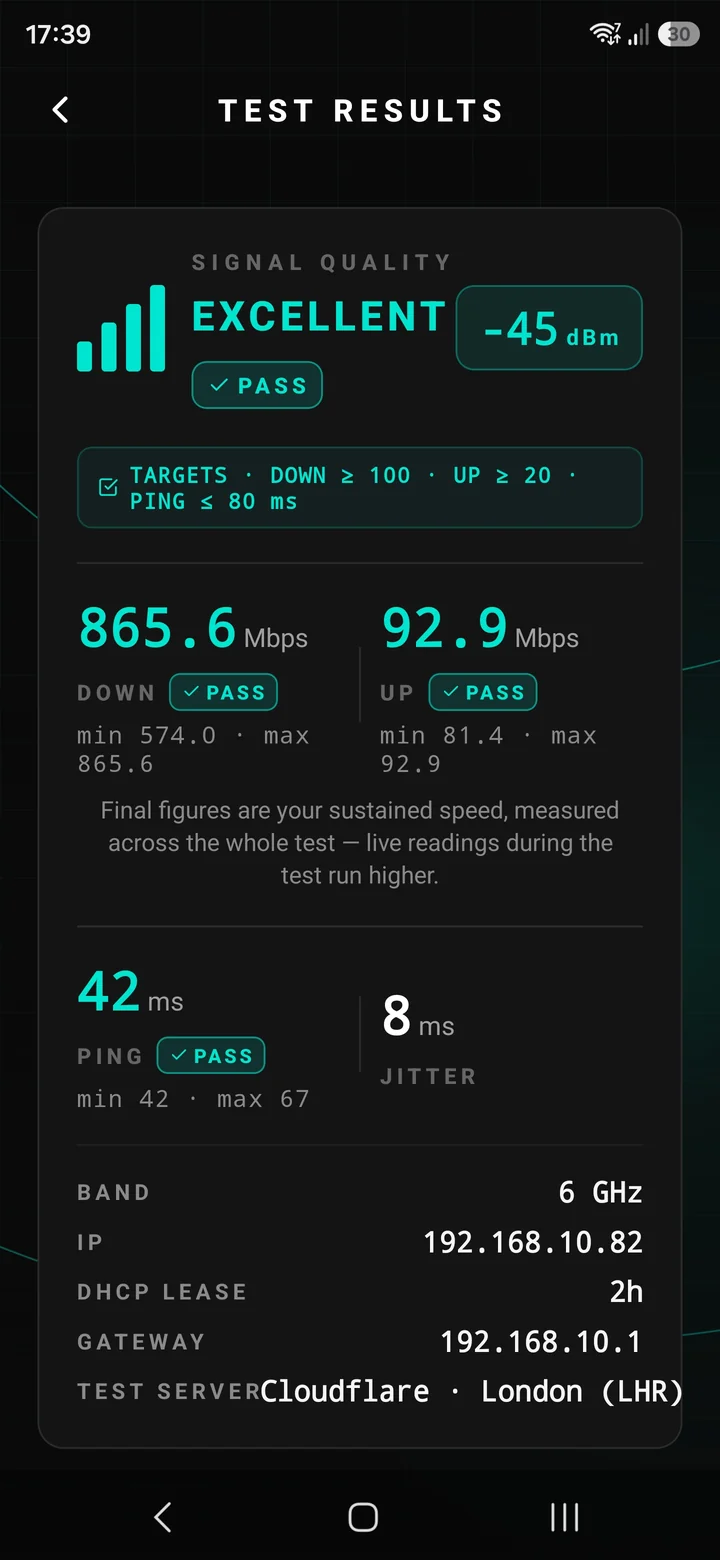
Built around one honest structure — Property → Access Point → Test Spot.
Most WiFi problems get diagnosed with a shrug and a "yeah looks fine over here". SignalMetrics fixes that. A full house survey is organised, repeatable, and quotable — every time.
Prove a coverage gap
Walk the property once, hand the customer the number in every room, quote the mesh upgrade or extra AP with evidence.
Verify a fresh install
Every spot hits the customer's paid-for speeds — not just next to the router. Sign-off has an audit trail.
Investigate a slow-WiFi callback
Turn up, tap TEST at the four rooms they complained about, see the pattern in ten minutes flat.
Hand the customer evidence
Professional PDF with speeds, spots and pass/fail marks for every room — signed off before you leave the driveway.
Every feature earned its place on a real job.
The whole network on the report — not just what answers
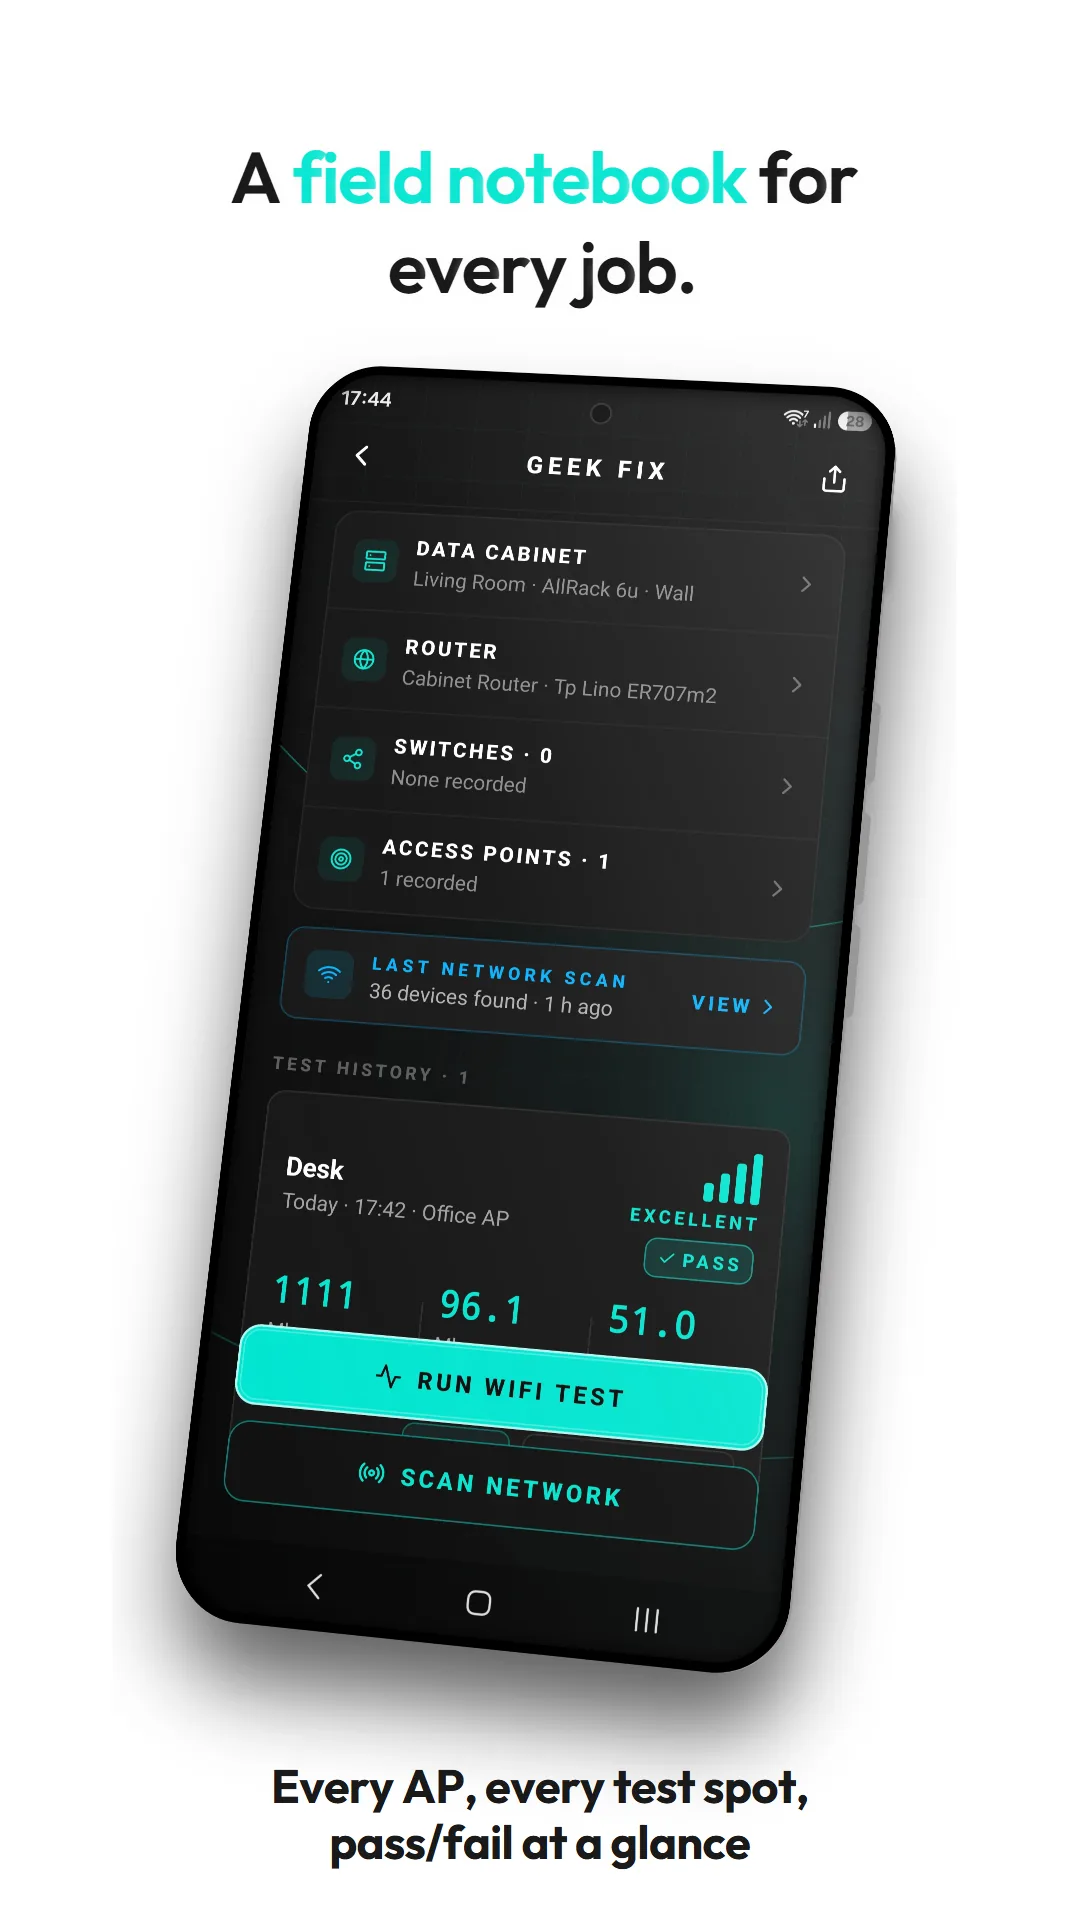
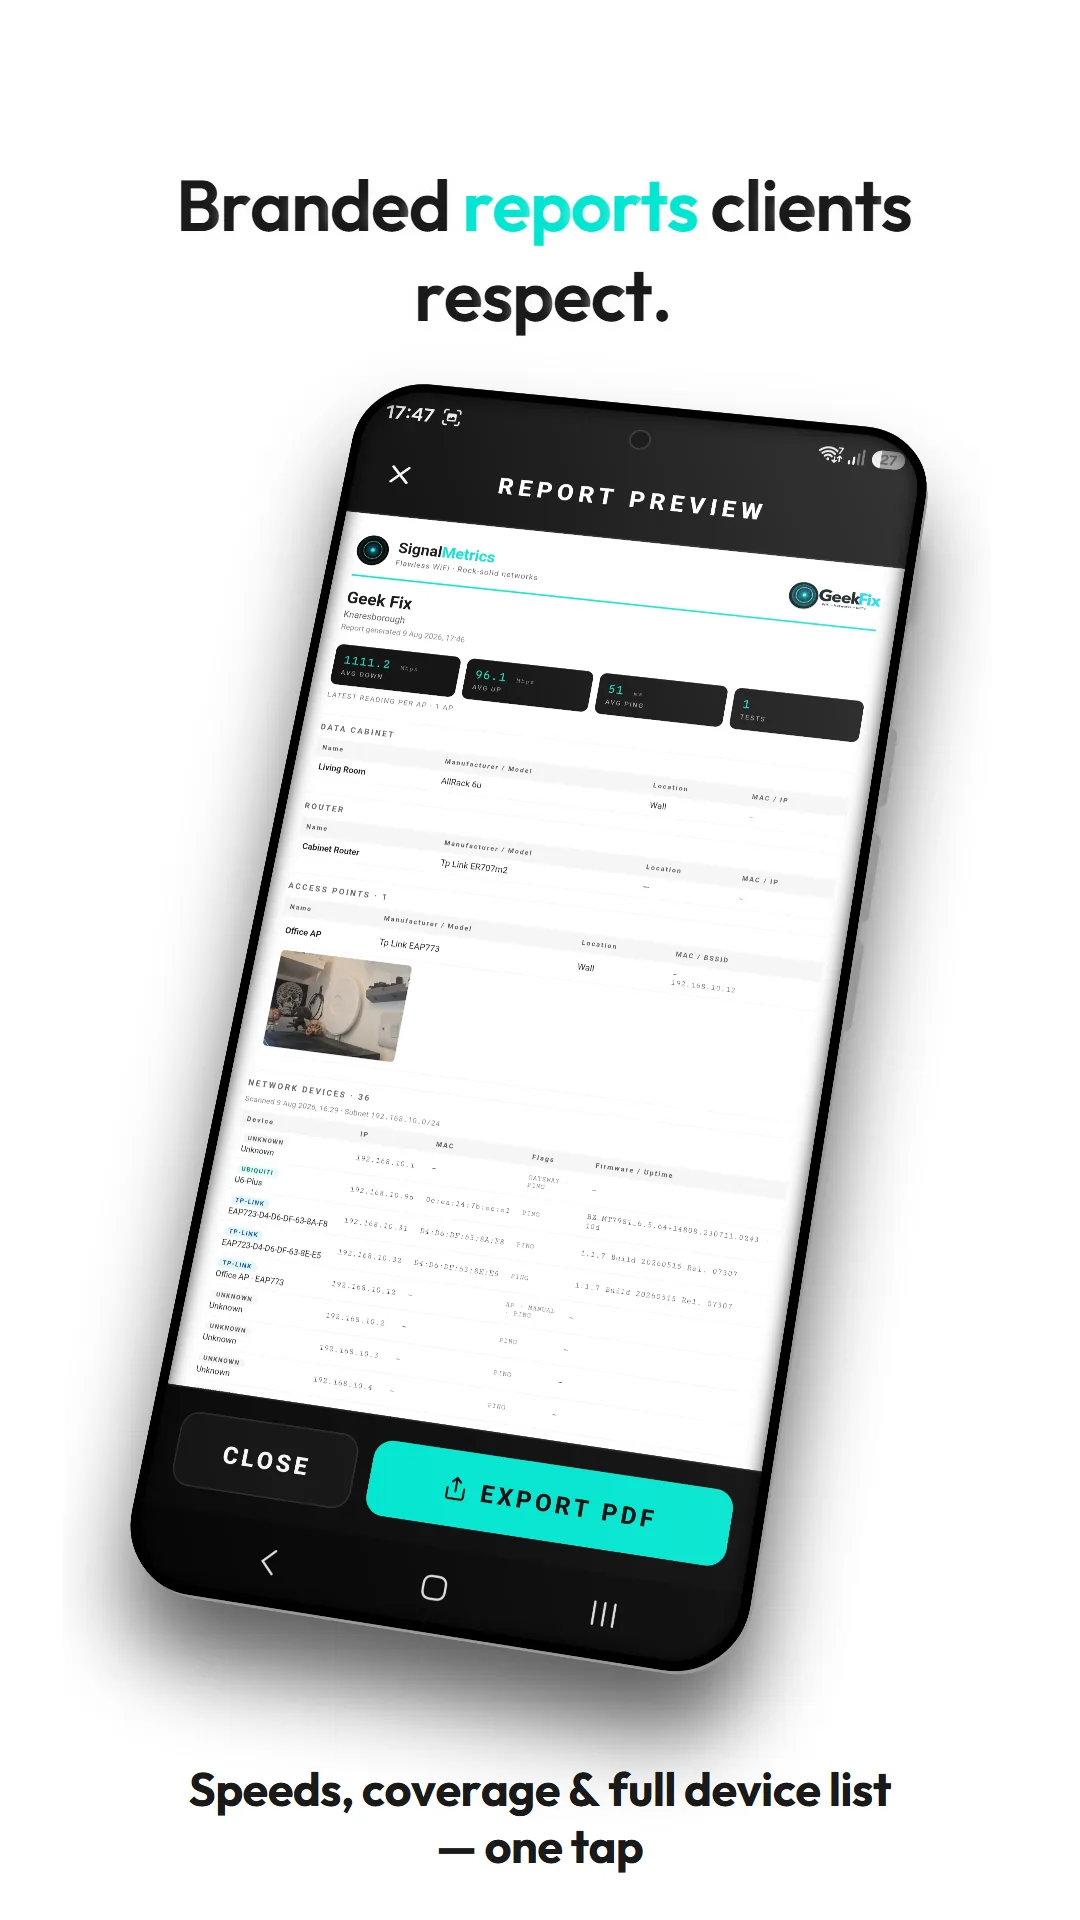
Adopted Omada and UniFi access points go quiet the moment a controller takes over — and vanish from an ordinary scan. Record each one once, with its IP, and it lands on the survey report as installed hardware whether the live scan sees it or not. The gear that doesn't answer is exactly the gear a lesser tool forgets — so your customer's report shows the complete estate, not a partial list.
Speed and signal, graded separately
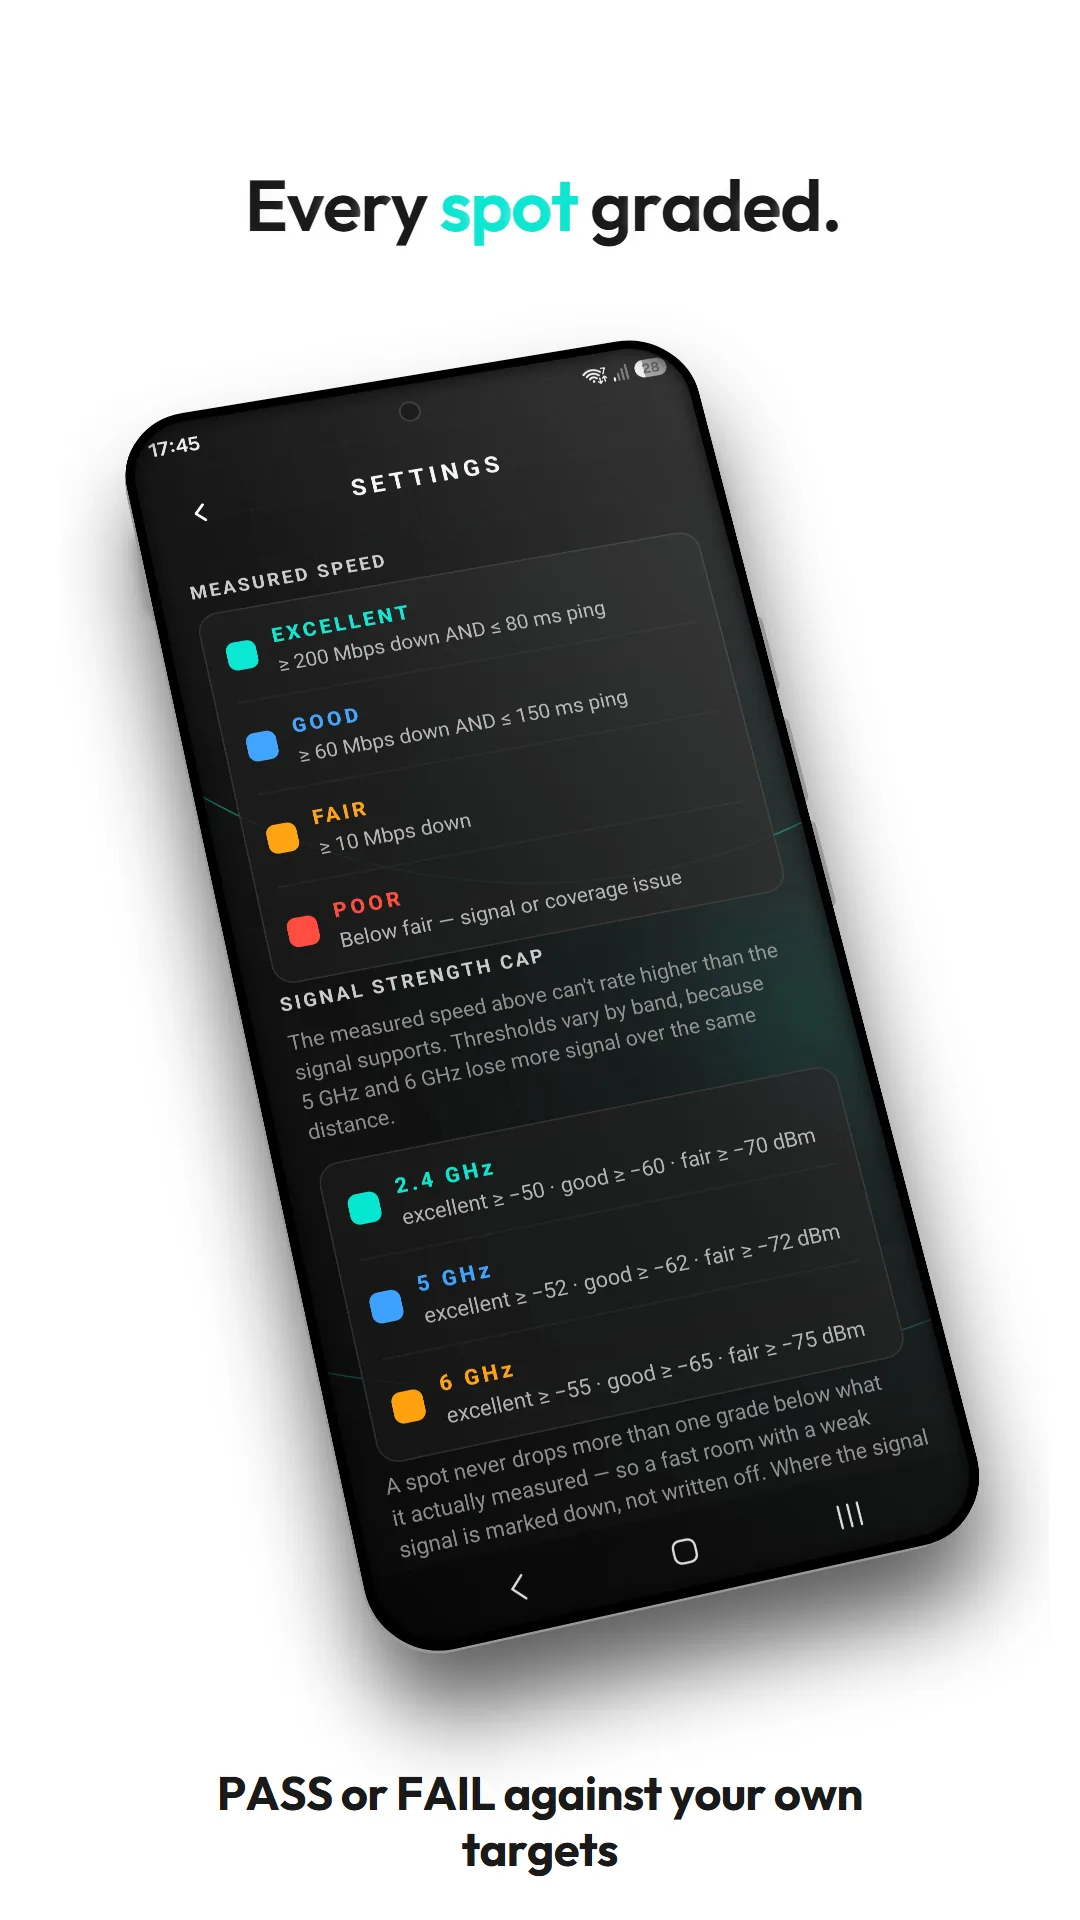
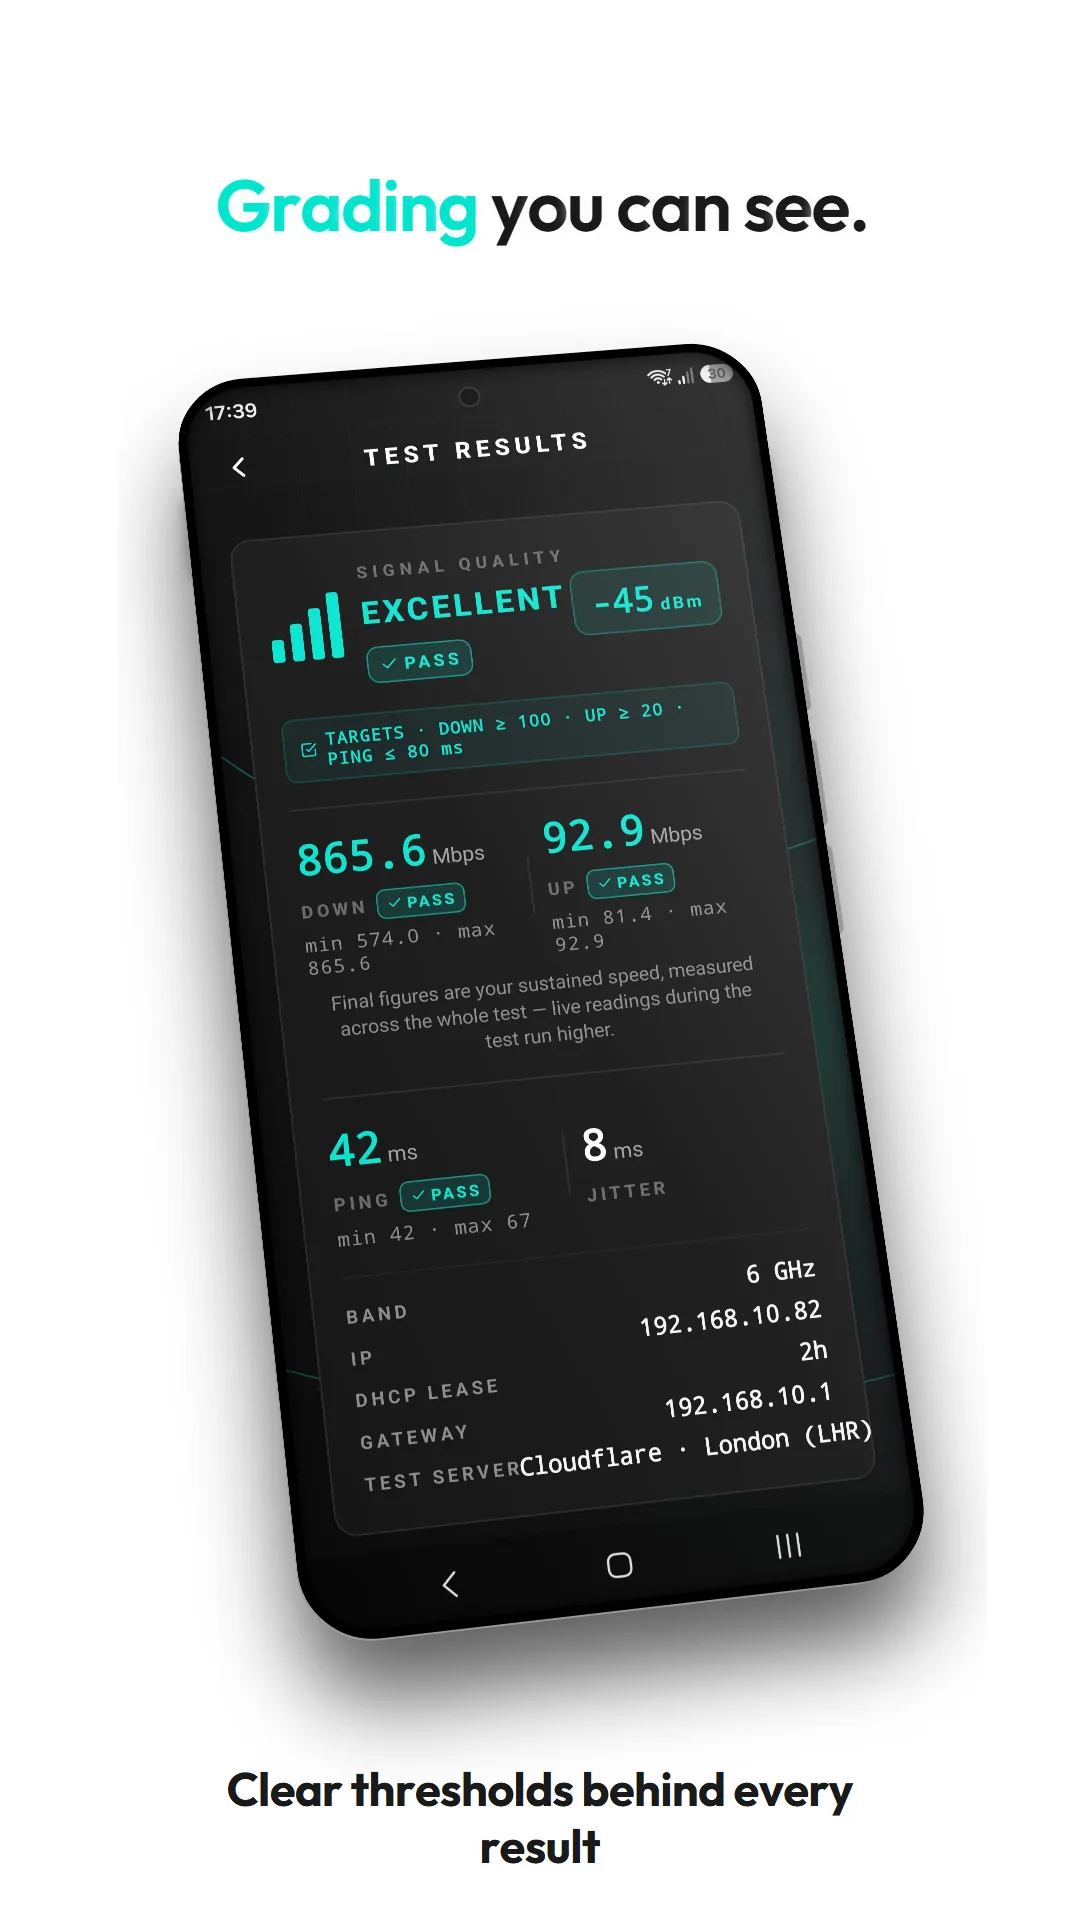
A fast download in a room with a weak signal isn't a good result — it's one that collapses the moment a door closes. So tests show a Speed grade and a Signal grade side by side: you see exactly which one is holding a room back, instead of one number that hides the reason. A weak signal still pulls the grade down — a room can't rate better than the signal honestly supports.
Cloudflare-edge speed testing
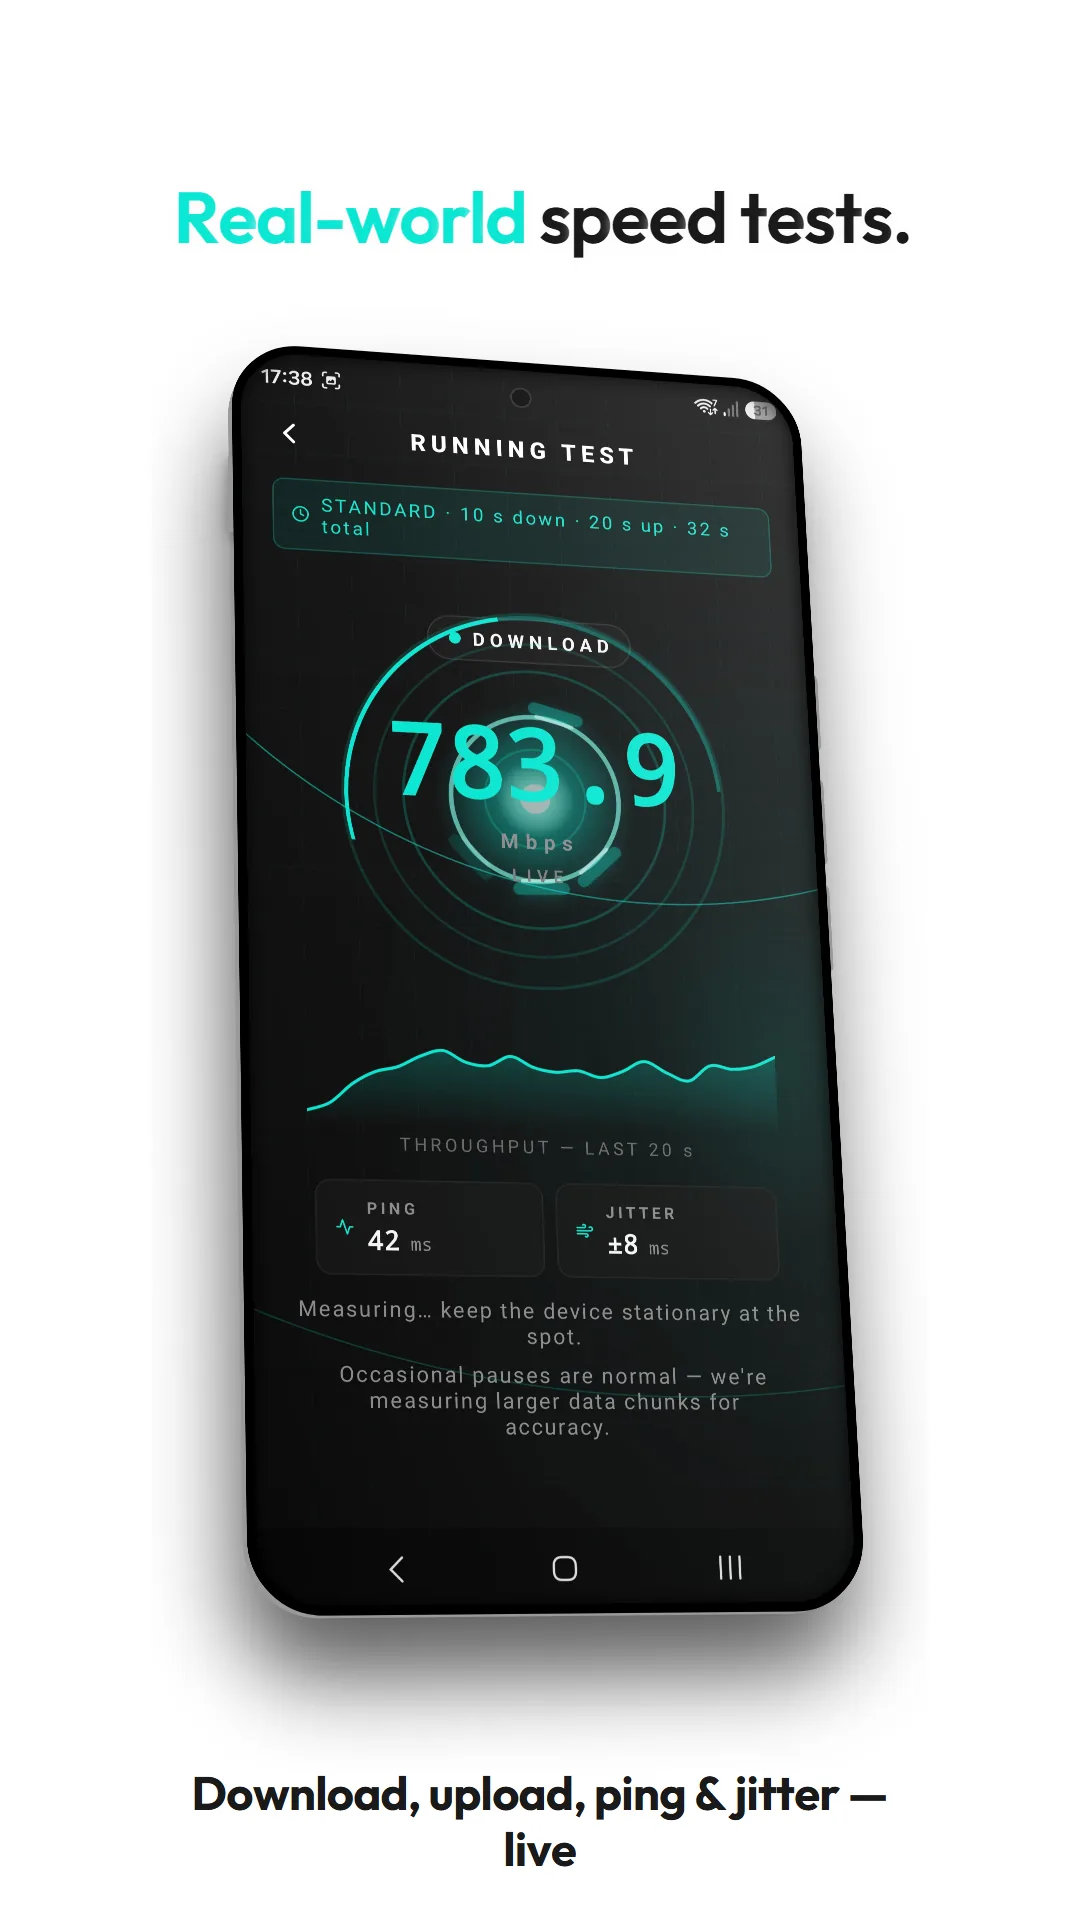
Download and upload measured directly against Cloudflare's global edge, with min / max / median tracking, ping, jitter, and a live sparkline while the test runs.
Native WiFi detection
Auto-detects the SSID, BSSID, band (2.4 / 5 / 6 GHz), gateway IP, DHCP lease, and RSSI in dBm on every test — no manual entry, no guessing. Uses a patched native WiFi module for the values Android normally hides.
Per-property pass / fail targets
Set three sliders for each customer — Download (25–1000 Mbps), Upload (5–500 Mbps), Ping (10–500 ms). Every test at that property is graded against those thresholds instantly, with a PASS / N-of-3 badge on each spot.
At-a-glance property health
Every property and access-point card carries a subtle colour tint reflecting its worst recent test. Green means every spot is hitting target; orange means marginal; red means something needs fixing before you leave.
Full network device scan
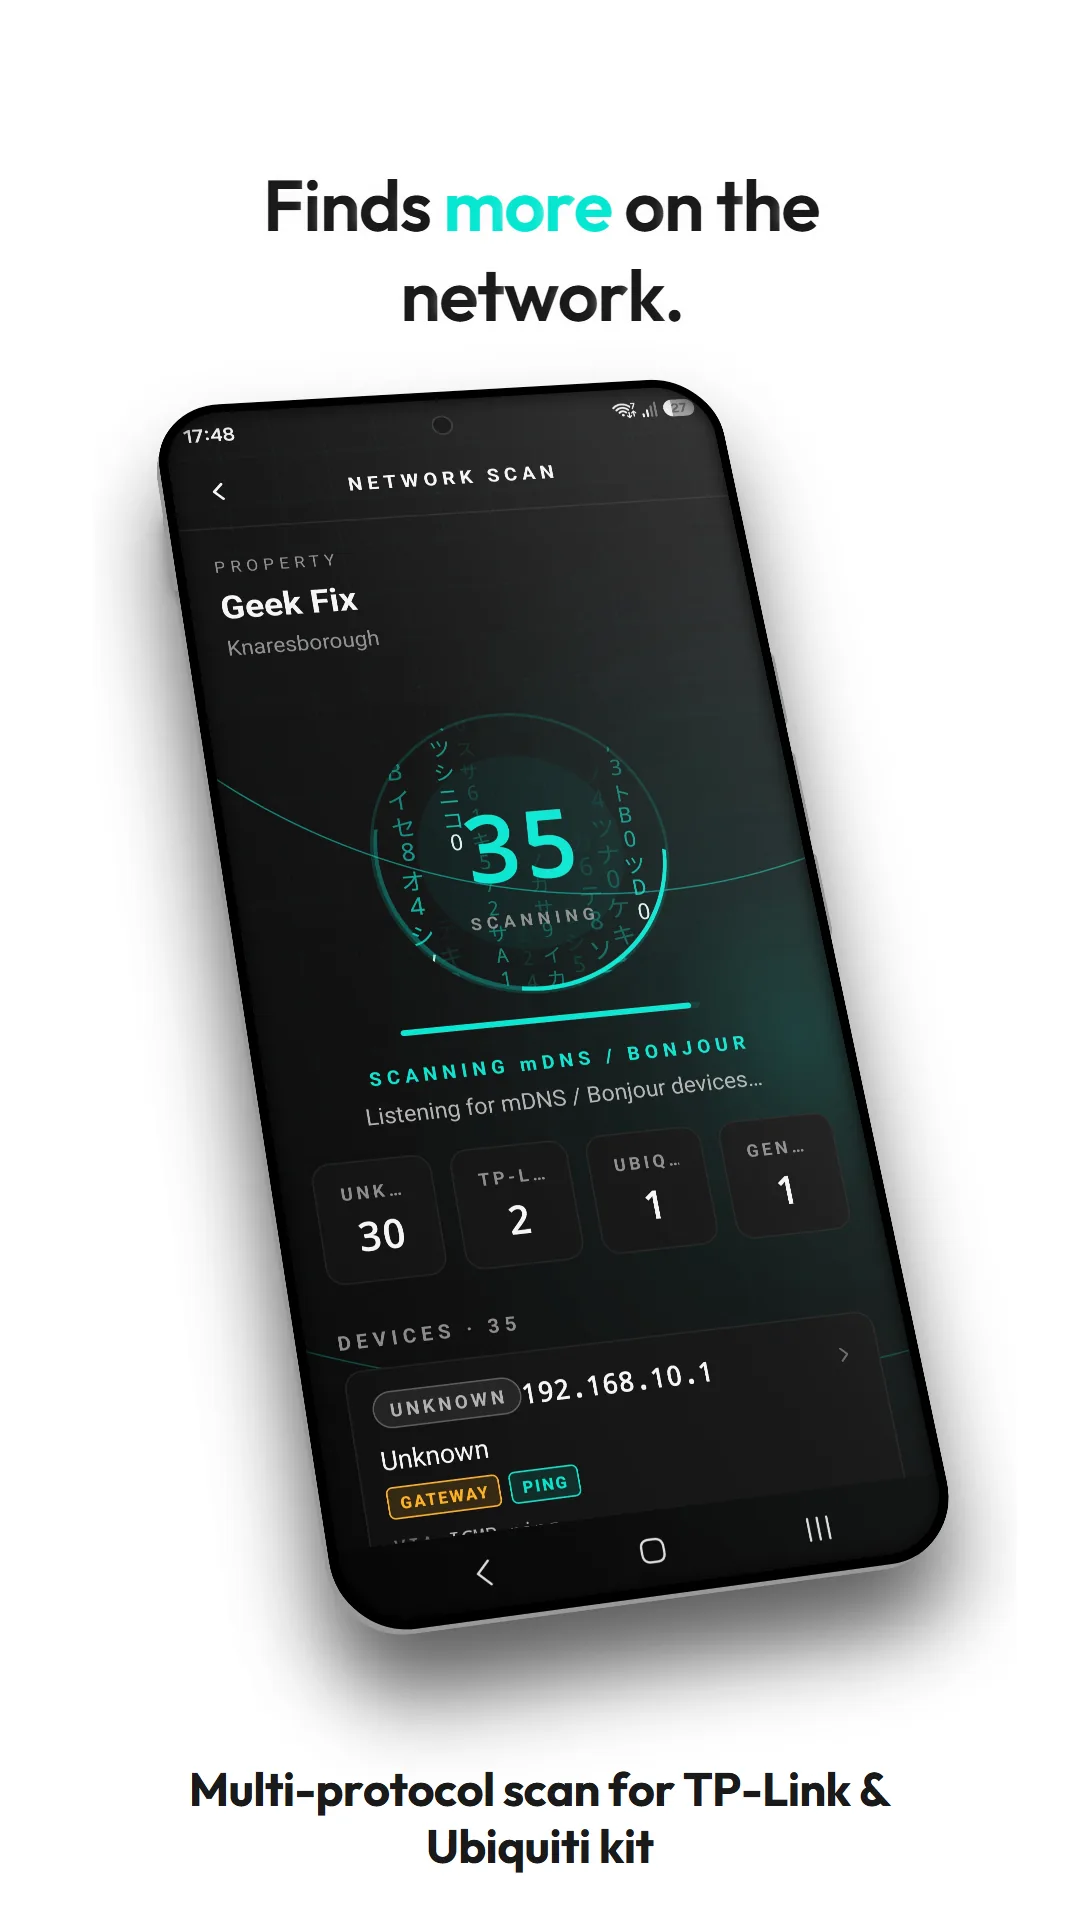
A proper LAN sweep, not a curiosity feature. Custom Kotlin engine fans out ICMP + TCP across the /24 in parallel (about 2 seconds), then merges with UDP discovery (Omada ECSP JSON + Ubiquiti TLV), mDNS/Bonjour, SSDP and HTTP fingerprinting.
Per-device detail & vendor labelling
Every device gets flagged for pingable / has-website / has-Bonjour / has-UPnP / is-gateway / open-ports. TP-Link Omada, Deco and Archer gear, plus Ubiquiti UniFi and EdgeMax kit, are labelled by model where the network probe returns enough detail — and where it doesn't, your own records fill the gap: enter a manufacturer, or match a device by its IP, and it's labelled on the report regardless. Unknown IoT and end-of-life gear still stand out at a glance.
ISP & Starlink WAN detection
Identifies the likely upstream provider — including Starlink — by matching the connection's public IP against an on-device table of UK ISP and Starlink network ranges. Nothing about the connection leaves the phone. Handy for a quick sanity check that a Starlink install is egressing via SpaceX rather than falling back to a hotspot mid-survey. Shown as a "likely" match, since wholesale and resale mean the billing provider and the routing network can differ.
A photo of every access point you install
Attach one photo to each access-point record — straight from the camera or picked from the gallery — and it appears in the exported PDF handover alongside the AP's name, model, mount location and notes. Proof of workmanship for the customer, and a permanent record of exactly where and how each unit was mounted. Photos are resized and stored locally on the device — never uploaded.
Branded PDF reports
Generate a shareable PDF with the Geek Fix logo, the property address, every spot's speeds and the customer's target thresholds. Send it from the phone via WhatsApp, email or AirDrop — no portal, no waiting for a cloud sync.
A proper tour — no dashboards.
Everything the app does is one or two taps deep. Below is a real tour, on a real property, from a real install.
Introducing the WiFi Analyzer.
See every network around you
A live view of every access point nearby, with signal strength, band and channel, and a clear marker on the one you're connected to. It updates as you move, so you can spot congestion and pick a clean channel on site.
Room and Spot are now optional
Save a test with as much or as little detail as the job needs. Room and Spot are no longer required, so a quick check doesn't become a form-filling exercise when you're working at pace.
WiFi refresh in one tap
The pre-test WiFi refresh now opens as a panel where you are, instead of sending you out to Settings and back. One tap, then straight into the test.
Sharper scans under the hood
A refreshed ISP database and clearer identification of network equipment on scans, so a survey names more of what it finds instead of leaving you to work it out afterwards.
Plus a range of fixes and refinements across the app.
Why our numbers look different — and why they matter more
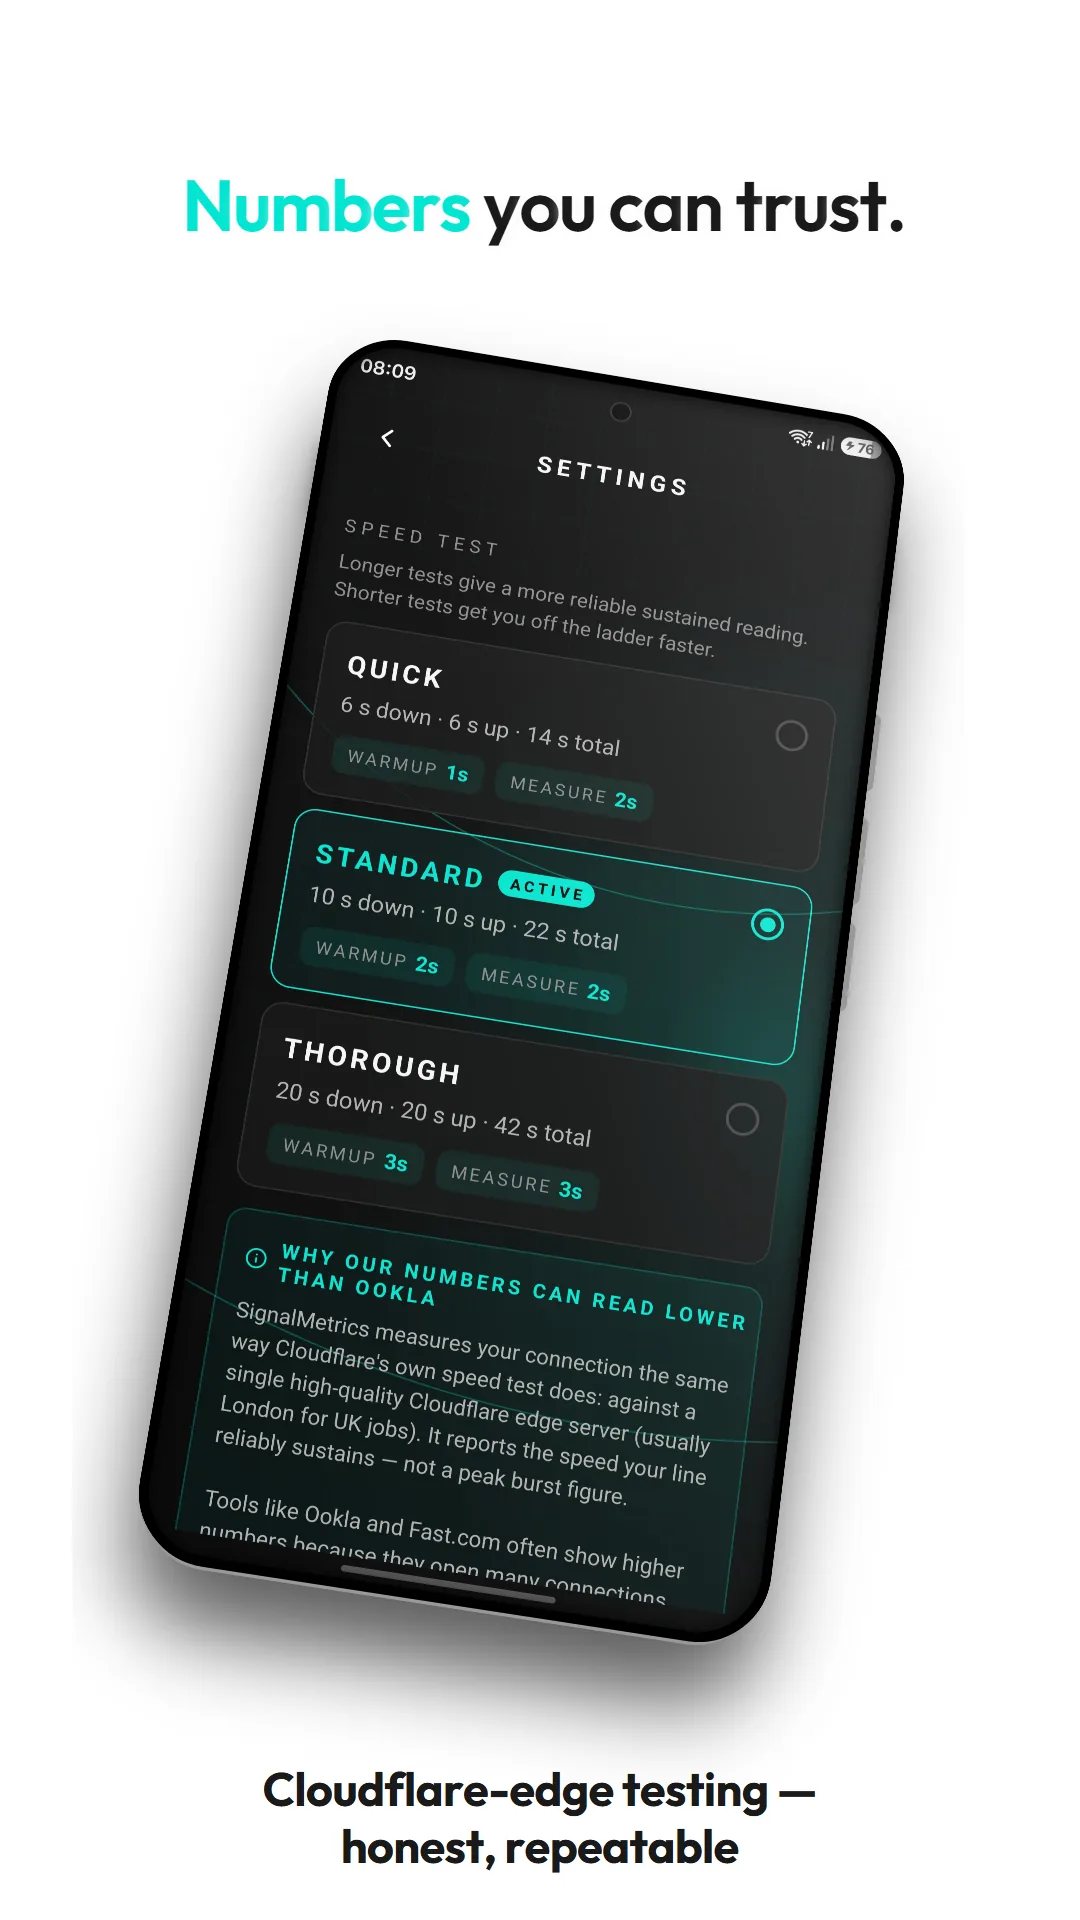
We measure a single sustained connection — the way you actually use the internet — not the peak-burst number other apps chase.
When you actually use the internet — loading a website, joining a game server, connecting to your bank — your device makes one connection and holds it. That's what we measure: a single, sustained connection, run the same way every time, against the same server. It's a real-world reading of what one connection reliably gets in that spot.
Speed-test apps like Ookla and Fast do something different on purpose. They pick the nearest, fastest server and open several connections at once to show the absolute peak your line can hit. That's a genuinely useful number — it's the top of what your line can do — but it isn't what a single real connection experiences day to day.
The sites and services you use don't care about your line's maximum burst. They care whether one connection stays fast and stable. That's exactly what we test — which is why our numbers read lower than a peak-speed app, and why, for a survey you're handing a client, they matter more.
From every other speed-test app on the store.
Built by an installer, for installers
Every feature earned its place on a real job. If it isn't useful on-site, it isn't in the app.
No account, no login, no server
Faster to launch, works in a Faraday-cage flat, and keeps customer data off other people's computers.
Cloudflare-grade speed test
Direct timed fetch/upload against Cloudflare's edge for trustworthy, real-world numbers — no telemetry leakage.
Native LAN scanner, not a script
Kotlin with proper coroutines so a full /24 completes while you're still walking to the next room.
Privacy-first by default
No analytics SDK. No crash reporter phoning home. No login. A customer's WiFi topology is their business.
Every measurement stays on your phone.
No account. No cloud. No analytics SDK. No crash reporter phoning home. Uninstall SignalMetrics and every property, every test, every scan goes with it. A customer's WiFi topology is their business — not ours, not anyone else's.
People whose day involves walking around holding a phone.
Independent WiFi / smart-home installers
Prove coverage before and after every install.
IT consultants
Quick on-site audits for SMEs and home offices.
Landlords and property managers
Validate a mesh upgrade actually reached the loft conversion.
Anyone doing enough WiFi work
That walking around holding your phone is already part of the job.
For the tech-curious.
- Built with Expo (React Native) — one codebase, native performance where it matters.
- Custom native Expo module (NetScan) written in Kotlin, using coroutines +
Semaphorefor bounded concurrency so a Pixel doesn't thermally throttle mid-scan. - Speed engine hand-rolled against Cloudflare's
/__downand/__upendpoints using Cloudflare's own per-request timed methodology — reporting sustained single-edge throughput, not an inflated headline peak. - Zero third-party analytics or crash-reporting SDKs.
- Local SQLite for structured storage — no leaky
AsyncStorageblobs.
Things people ask before they hit install.
Does the app upload my customer's data anywhere?
Why are your speeds lower than Ookla or Fast?
Do I need to be online for it to work?
Which routers can the scanner identify?
Can I export the report as anything other than PDF?
Now available on Google Play.
Free to use on your own work, personal or professional — no subscription, no in-app purchases. The app itself stays ours: no reselling or rebranding it without a word with us. Want it under your own branding? A rebrandable edition for installers is on the way — email us for early access. And if you just want to say thanks — book Geek Fix for your next WiFi install.